Concept demo · data and AI
Mira
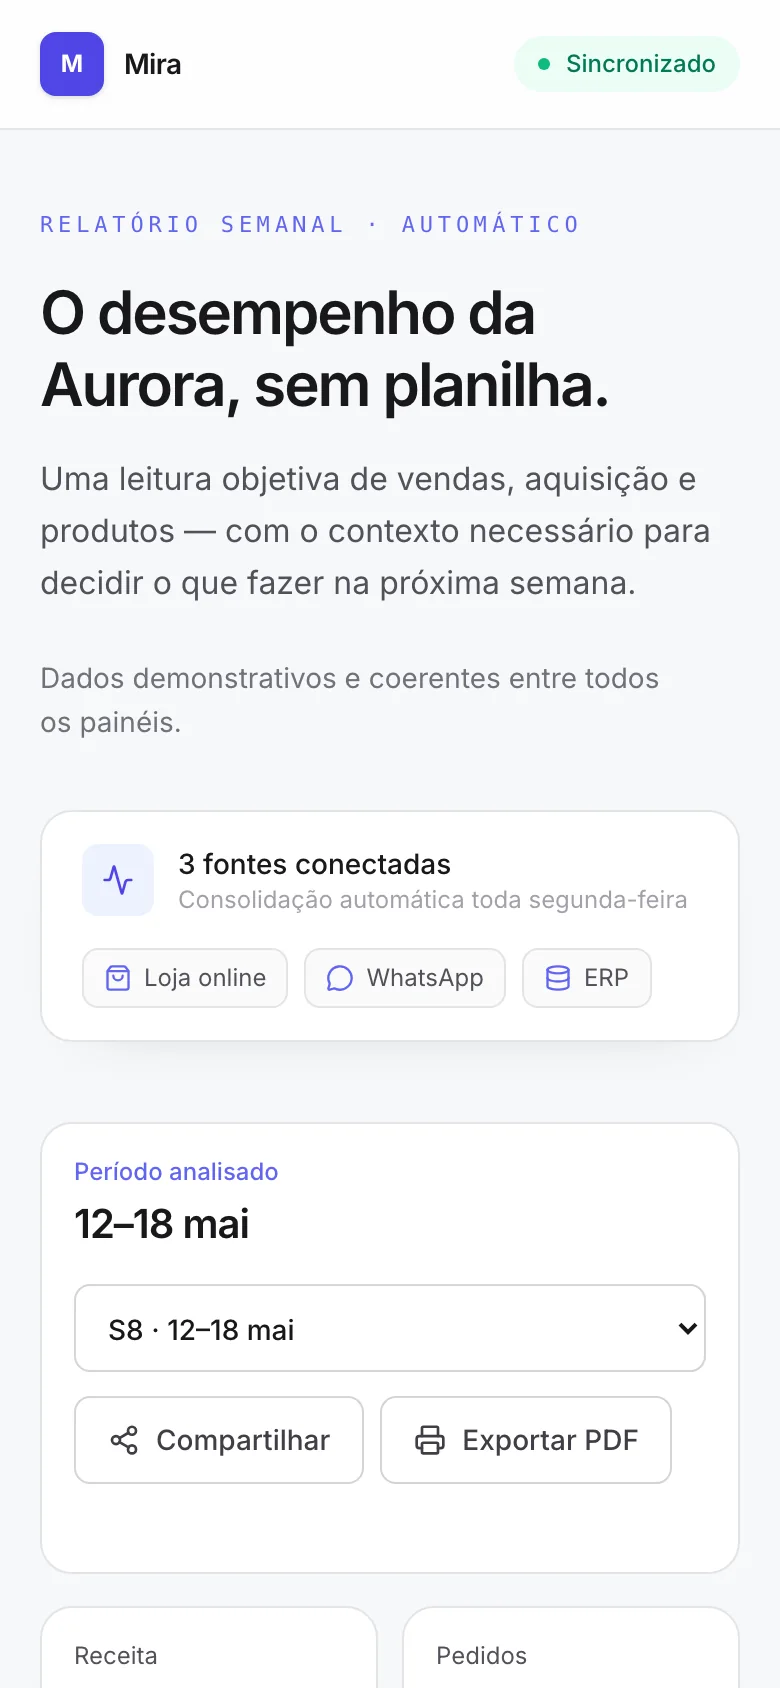
A weekly business report that organizes metrics, channels, products, and an AI-assisted summary into a direct reading experience.
- Type
- Concept demo
- Role
- Design and development
- Format
- Web dashboard
01 · Technical and design decisions
Dense information, simple reading
Hierarchy before volume
Primary metrics, weekly trends, channels, and products are organized into blocks with clear visual levels.
A chart without extra dependencies
The weekly visualization uses SVG and React components, keeping the example lightweight and controllable.
AI as synthesis
The intelligent summary sits beside the data to demonstrate an interpretation layer without turning the dashboard into a chat.
02 · Learning
A dashboard should guide, not merely display
The exercise showed how contrast, order, and supporting copy can turn different data formats into a short, scannable narrative.
Technologies
- Next.js
- React
- TypeScript
- Tailwind CSS
- SVG
Need to turn data into a clear interface?
I can adapt this approach to a dashboard, report, or system connected to your business needs.